Detecting The Fraud In Enron
Mohd Hassaan
Introduction
In 2000, Enron was one of the largest companies in the United States. By 2002, it had collapsed into bankruptcy due to widespread corporate fraud. In the resulting Federal investigation, there was a significant amount of typically confidential information entered into public record, including tens of thousands of emails and detailed financial data for top executives. In this report we share our effort to identify the fraudents using the emails and financial data available in the public domain.
Data Discription
The below tables represents a simple exploration of the enron data.
| Data Types | Value |
|---|---|
| No of data Points | 146 |
| No of Features | 21 |
| No of POIs(Points of Intrest) | 18 |
| No of Non POIs | 128 |
| No of employees without salary | 51 |
| No of employees with salary | 95 |
| No of employees with unknown total payments | 21 |
| No of POI where total payment is NaN | 0 |
| No of employees with email address | 111 |
Features with most of the missing values 
| Features | Missing Value (%) |
|---|---|
| deferral payments | 73.28 |
| loan advances | 97.26 |
| restricted stock deferred | 87.67 |
| deferred income | 66.43 |
| long term incentive | 54.79 |
| director fees | 88.35 |
Features with most of the missing values In case Of POI 
| Features | Missing Value (%) |
|---|---|
| deferral payments | 72.22 |
| loan advances | 94.44 |
| restricted stock deferred | 100.0 |
| deferred income | 38.88 |
| long term incentive | 33.33 |
| director fees | 100.0 |
The values of Deferral payments, loan advances, restricted stock deferred and direct fees are missing in huge numbers in case of POI.
Outliars Processing
Here we look our data to check for outliars, and remove it if needed.
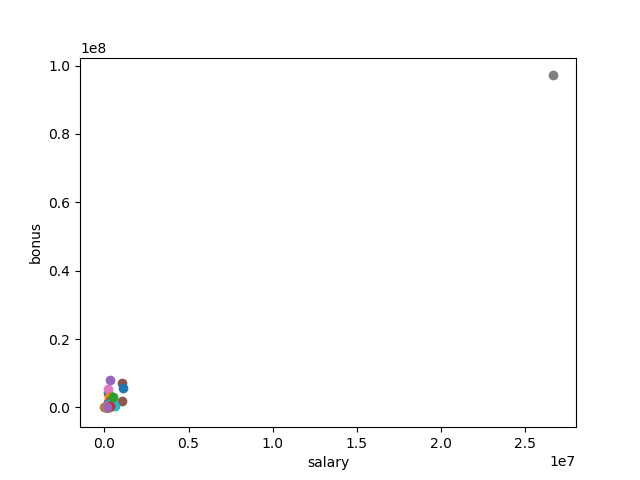
In the above graph we can see that there is one data point which is far away from the rest of the data, which seems like a outliar. After checking carefully, we found out that this data point(TOTAL) is the total value of all the data. This outliar must be removed as it can effect out prediction model.
The below graph represents the data after the removal of outliars
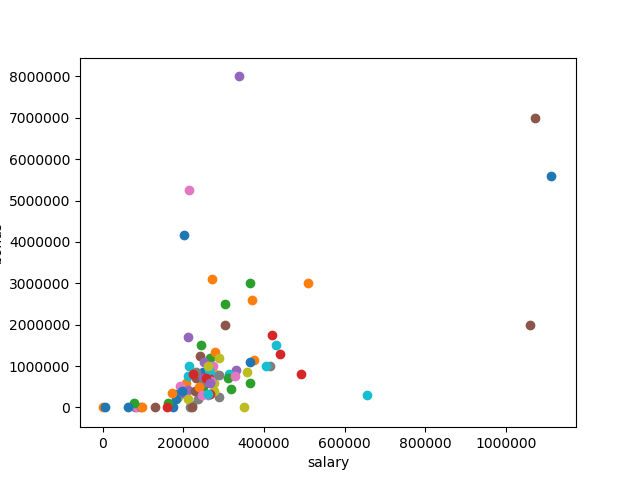
Key Take aways
The data set does not include all the POIs as some are missing in the data.
Kenneth Lay along with few others get most of the salary, but we did not remove these outliars as these are real people with real values.
Features Processing
In order to get more accurate prediction, we have to make some new features from the existing once. After struggling with lot of new features. I came up with two new features.
Fraction of emails to a person from the person of intrest.
Fraction of emails from a person to the person of intrest.
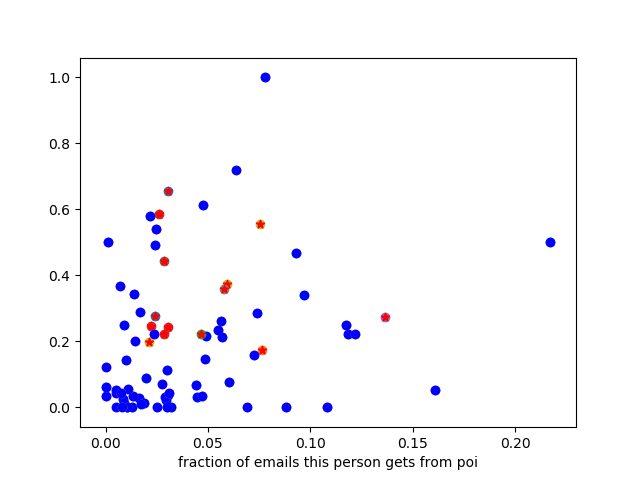
From the above graph it is evident that a relationship is there between the POI's and Non POI's via email. We can see further that there is no POI below 0.2 in the Y-axis.
Features ranking
Below are the approximate freature rankings of the features we find of the features. We use the decision tree classifier to get the feature ranking and other values below.
| Features | Importance |
|---|---|
| salary | 0.195302795031 |
| bonus | 0.158290984378 |
| fraction_from_poi_email | 0.14622972935 |
| fraction_to_poi_email | 0.128198757764 |
| deferral_payments | 0.118337314859 |
| total_payments | 0.0879795396419 |
| loan_advances | 0.0745332011969 |
| restricted_stock_deferred | 0.0534161490683 |
| deferred_income | 0.0377115287109 |
| total_stock_value | 0.0 |
| expenses | 0.0 |
| exercised_stock_options | 0.0 |
| long_term_incentive | 0.0 |
| shared_receipt_with_poi | 0.0 |
| restricted_stock | 0.0 |
| director_fees | 0.0 |
We can see from above chart that the importance of our new features fraction_from_poi_email, fraction_to_poi_email have higher importance than almost all predefined features with the exception of bonus and salary.
Approximate values
We have tried our classifier on all the features the result turned out to be the following
Accuracy Score: 0.66
Precesion: 0.25
Recall: 0.25
As we see above our accuracy is fine(not good) as compared to precision and recall but accuracy alone can't be a good factor for evaluation of algorithm as our precession and recall is much lower than it should be. Also most of the POIs are missing from the data so we can't use accuracy as the sole property to analyse the classifier. We need to manually pick fewer features as including all of them turned out to be a bad decision.
We have tried certain subset of features. High importance feature are taken in the subset along with some features which signifies similar attribute.
salary, bonus, long_term_incentive
Accuracy Score: 0.70
Precesion: 0.00
Recall: 0.00
fraction_from_poi_email, fraction_to_poi_email, shared_receipt_with_poi
Accuracy Score: 0.77
Precesion: 0.50
Recall: 0.50
deferral_payments, deferred_income, expenses
Accuracy Score: 0.75
Precesion: 0.00
Recall: 0.00
Final Features picked
Following are the features which is been choosen based on the above result.
- POI
- fraction_from_poi_email
- fraction_to_poi_email
- shared_receipt_with_poi
Algorithms Application and Tuning
I have tried three Classification Algorithms, the approx accuracy, precision and recall is mentioned below.
| Classification Algorithm | Accuracy | Precision | Recall |
|---|---|---|---|
| Naive Bayes | 0.266 | 0.181 | 0.5 |
| Decision Tree | 0.733 | 0.667 | 0.5 |
| Support Vector Machine (SVM)-LinearSVC | 0.467 | 0.1666 | 0.25 |
From the above table we can see that Decision tree classification algorithm is by far have the better accuracy, precision and recall. So we are going to stick with the Decision Tree Classification Algorithm.
Since we are moving ahead with Decision Tree Classification Algorithm, We are not doing any feature scaling. Feature scaling won't effect the outcome of decision tree.
Tuning the Data and Algorithm
Tuning an algorithms is a crucial part of machine learning. It is vital to improve performance as the attributes for a given method help to refine how that algorithm is processed. The tunable parameters of the classifier help us to improve the performance(accuracy, recall, precision etc).
Evaluation on various Split
We are now going to see the evaluation matrix of decision tree classification algorithm based on min sample split.
| SPLIT | ACCURACY | PRECISION | RECALL | TIME |
|---|---|---|---|---|
| 2 | 0.6667 | 0.3333 | 0.2500 | 0.0030 |
| 3 | 0.6667 | 0.4000 | 0.5000 | 0.0050 |
| 4 | 0.7333 | 0.5000 | 0.5000 | 0.0030 |
| 5 | 0.7333 | 0.5000 | 0.5000 | 0.0040 |
| 6 | 0.7333 | 0.5000 | 0.5000 | 0.0050 |
| 7 | 0.7333 | 0.5000 | 0.5000 | 0.0030 |
| 8 | 0.7333 | 0.5000 | 0.5000 | 0.0040 |
| 9 | 0.7333 | 0.5000 | 0.5000 | 0.0030 |
As we can see from above table min_sample_split for better score, precision and recall is 4 and 5.
Validation
Validation is also an important or we can say a must step in the machine learning process, It gives an estimate performance on independent datasets which is important because if we keep applying our classifier on the same data over and over again, we might get a perfect score but would fail to predict any thing on any new data set. So Validation is used to detect overfitting.
Resplitting the Data using KFold
Here is the real Machine learning techniques is been applied. We used the KFold algorithm to split the data into test and training set so that out score, precision and recall might increase. Also for small data KFold seems a better choice.
Below is the table representing the evaluation matrix of decision tree classified at various splits, but this time we are using the Kfold algorithm to split the data.
| SPLIT | ACCURACY | PRECISION | RECALL | TIME |
|---|---|---|---|---|
| 2 | 0.8259 | 0.4667 | 0.4861 | 0.0160 |
| 3 | 0.8378 | 0.5000 | 0.4861 | 0.0000 |
| 4 | 0.8259 | 0.4667 | 0.4861 | 0.0150 |
| 5 | 0.8498 | 0.5556 | 0.4861 | 0.0000 |
| 6 | 0.8498 | 0.5556 | 0.4861 | 0.0160 |
| 7 | 0.8378 | 0.5000 | 0.4861 | 0.0000 |
| 8 | 0.8498 | 0.5556 | 0.4861 | 0.0160 |
| 9 | 0.8498 | 0.5556 | 0.4861 | 0.0000 |
It is evident from the above table that Our accuracy is improved from 0.67 to 0.84, Precision from 0.32 to 0.55 and recall from 0.25 to 0.48.
Final Result
Before the tuning
Accuracy Score: 0.66
Precesion: 0.25
Recall: 0.25
After the tuning
Accuracy Score: 0.84
Precesion: 0.556
Recall: 0.486
The result simply means that (precision) 56% of the times classifier is successfully able to detect the POI and 44% of times it raise a false flag. And also (recall) 49% of the times classifier is successfully able to detect a POI if the given employee is POI.
Conclusion and my insight for future
I think the 'to' and 'from' email_feature are the most helpfull feature in making this classifier successfull. However more sophisticated feature can be built to make our case much stronger in identifying the fraud.
New features could be made using Expences, Deferred Income and Loan Advances because POIs must knew where the company is going so they must try to get more out of the company as fast as possible in the form of Expences, Loans etc.
New Features could help us in making our classifier much more stronger in the future.
Refrences
- Udacity Machine Learning course.
- Enron Data Set
- Enron Documantary
- SVM Docs Sklearn
- Naive Bayes Docs
- Decision Tree Docs
- KFold Docs